
SUMMARY
The global economy continues to prove surprisingly resilient. This is despite three months of geopolitical tensions in the Middle East, which have pushed oil prices to around $100 per barrel, fueling inflationary pressures and increasing uncertainty about the spending outlook of households and businesses.
GROWTH AND RATES
|
The opening section establishes the macro backdrop: growth has remained firmer than expected, and monetary conditions may not be as restrictive as central-bank language suggests. |
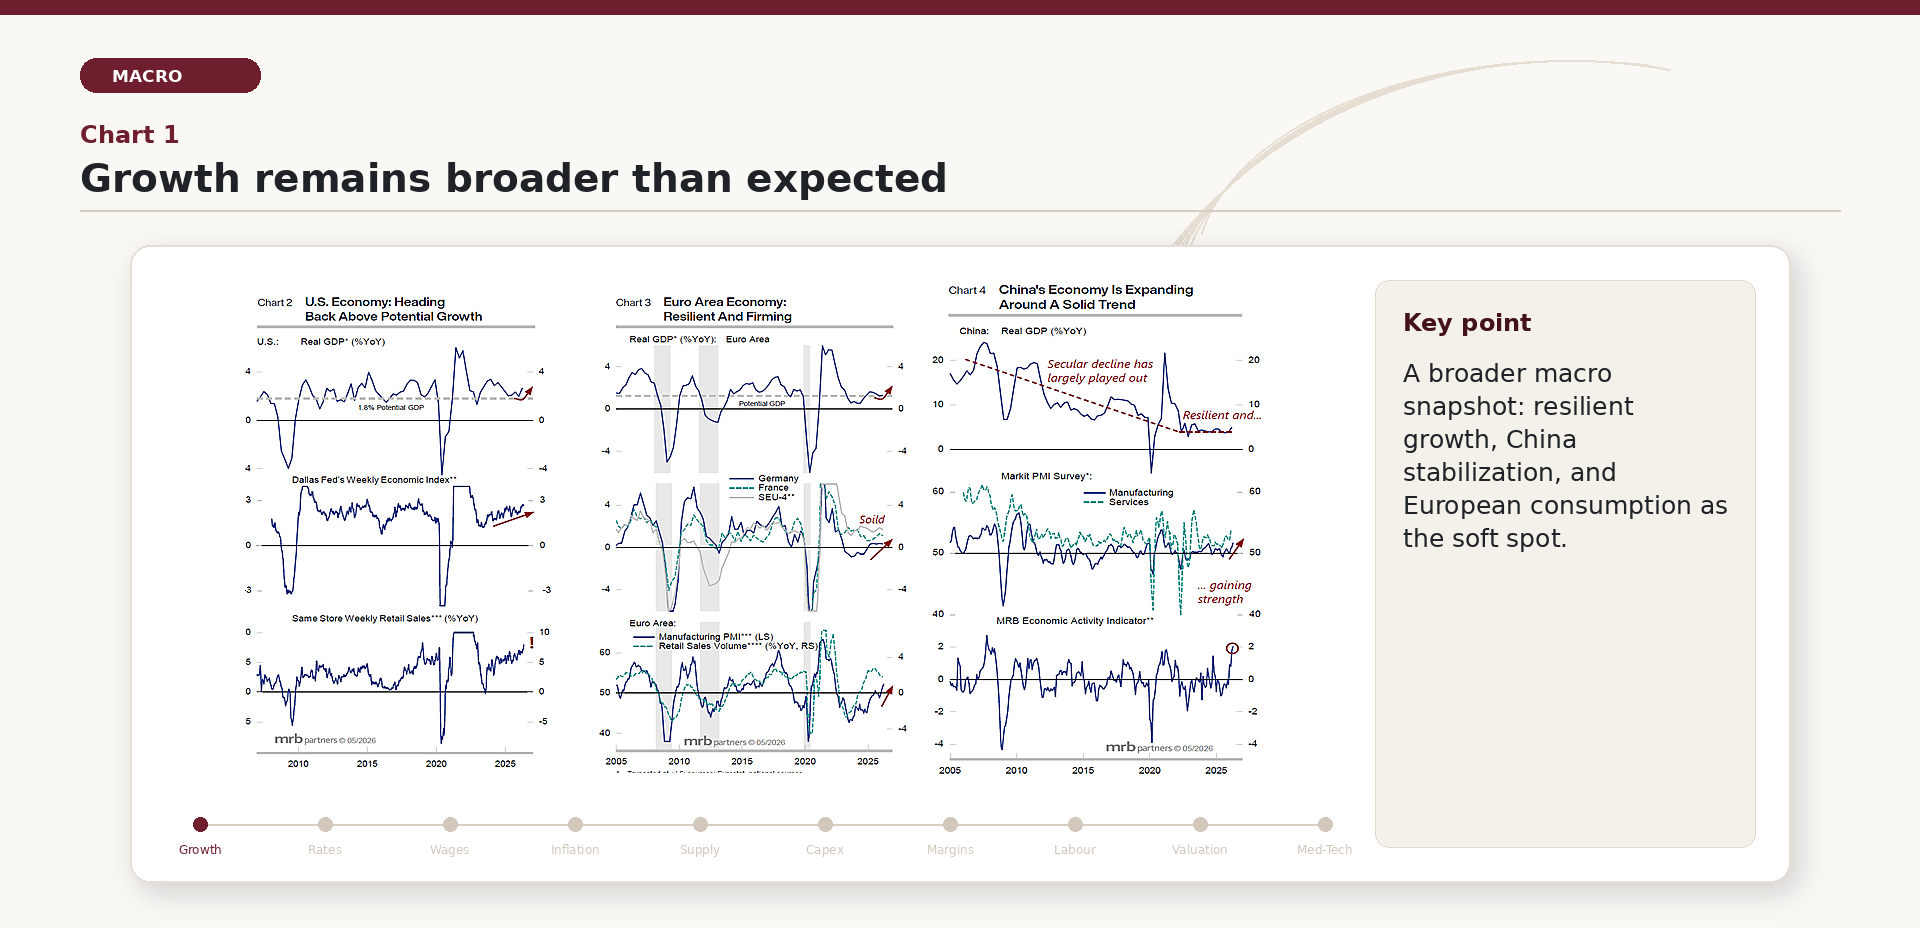
As shown in Chart 1 (United States on the right, Europe in the center, and China on the left), the overall macroeconomic picture is better than expected. Real GDP growth remains solid across all major regions: the United States and Europe are experiencing a reacceleration, while in China the multi-year slowdown trend appears to have stabilized (top chart in each region). The manufacturing cycle also supports this dynamic, particularly in the data related to the Chinese economy (central chart for China). The only area of weakness is European consumption (green dashed line in the lower chart for Europe), which is beginning to feel the impact of higher energy prices.
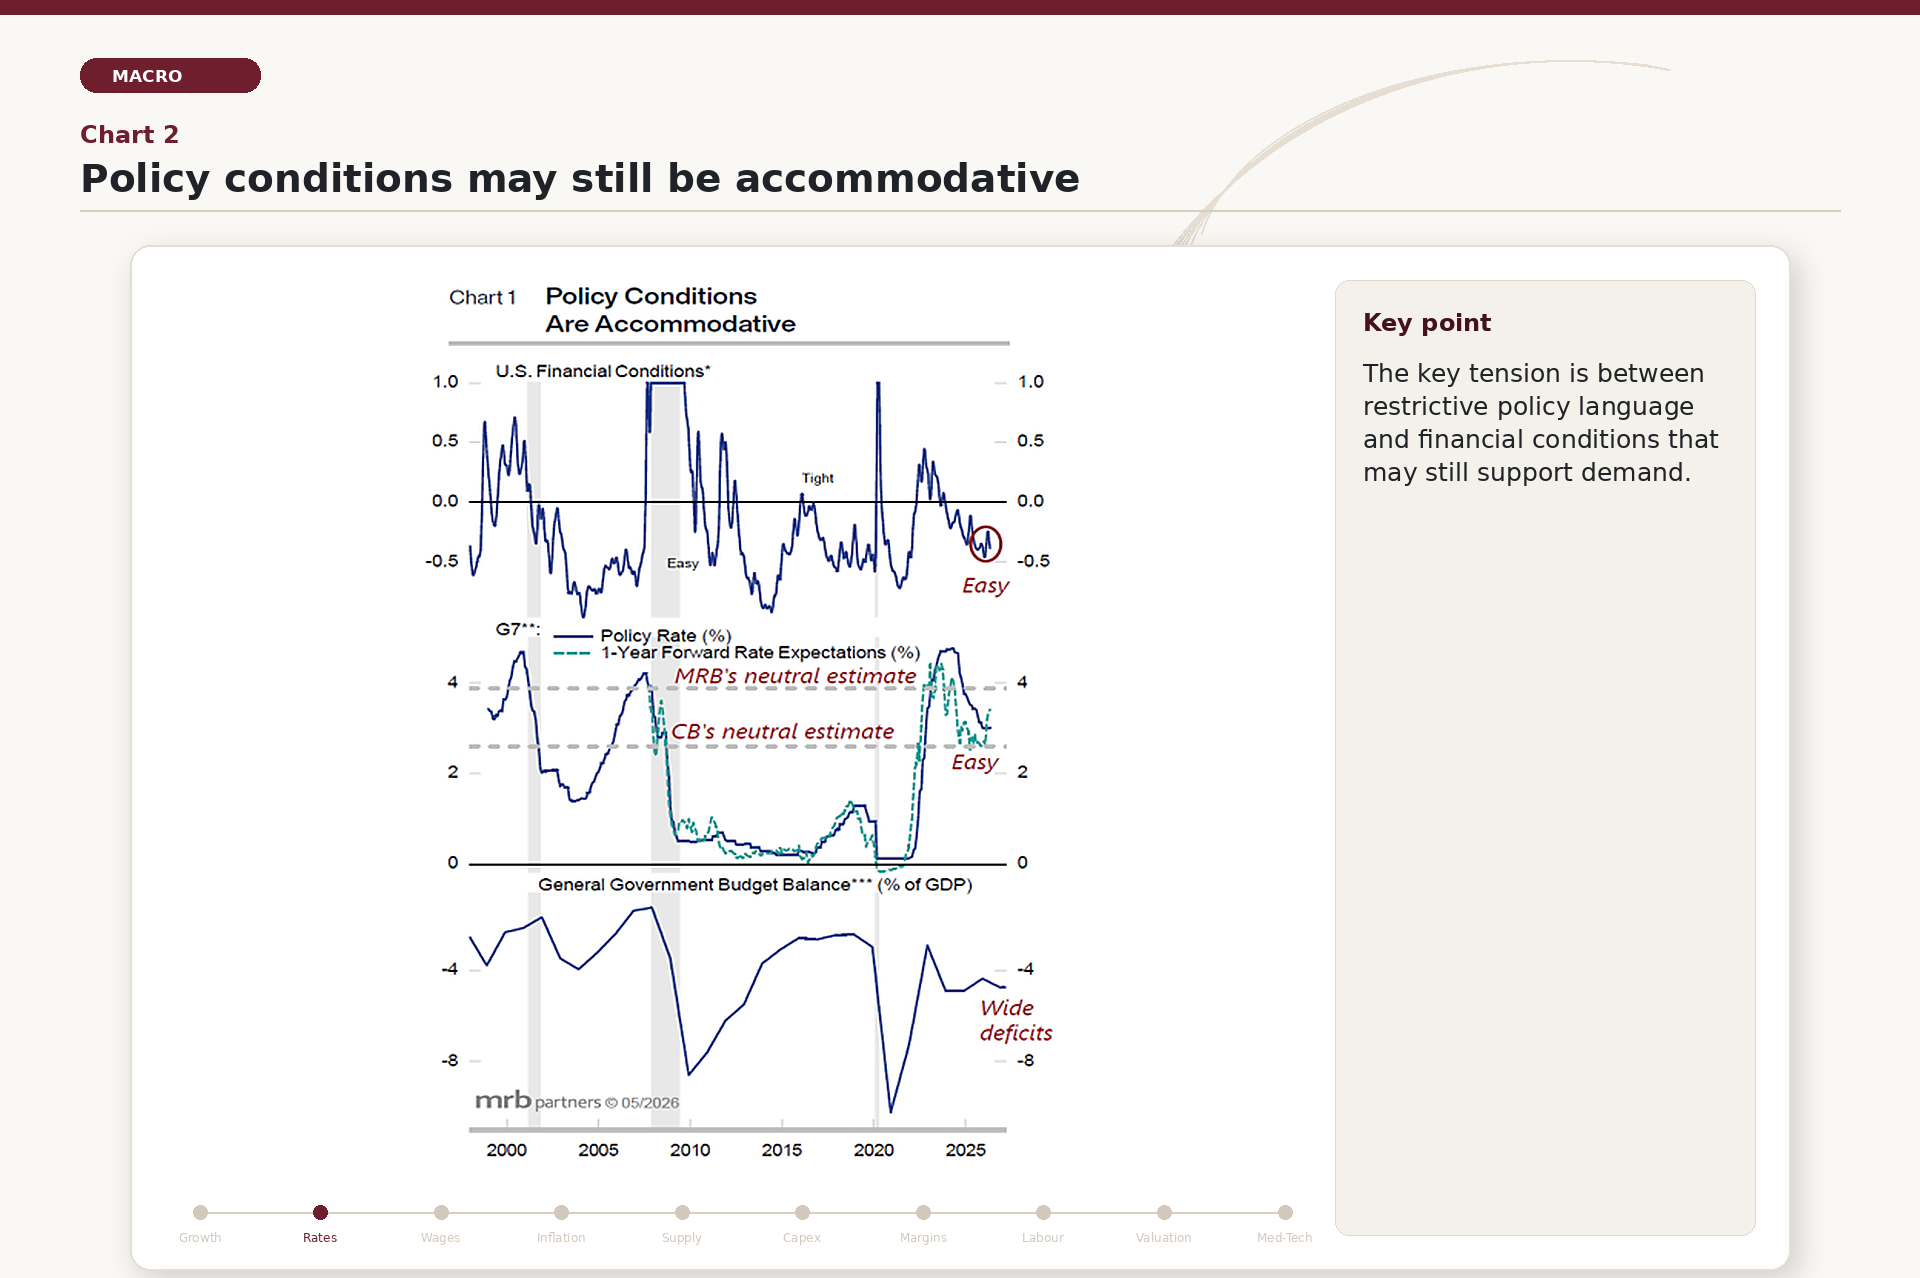
A key factor behind this resilience is the behavior of interest rates. As shown in Chart 2, although central banks continue to characterize monetary policy as restrictive, the reality appears somewhat different. According to MRB estimates, the effective neutral rate may be higher than current policy rates, implying that monetary conditions are, in fact, still accommodative. This view is supported by the ongoing acceleration in retail sales despite higher oil prices.
This dynamic is closely linked to the strength of the U.S. economy, which in recent years has shown limited sensitivity to higher interest rates. Despite tighter financial conditions, consumption and economic activity have remained robust. This is partly because households and corporations refinanced their debt during the period of near-zero interest rates, meaning that significantly higher rates would be required to materially impact demand.
SUMMARY
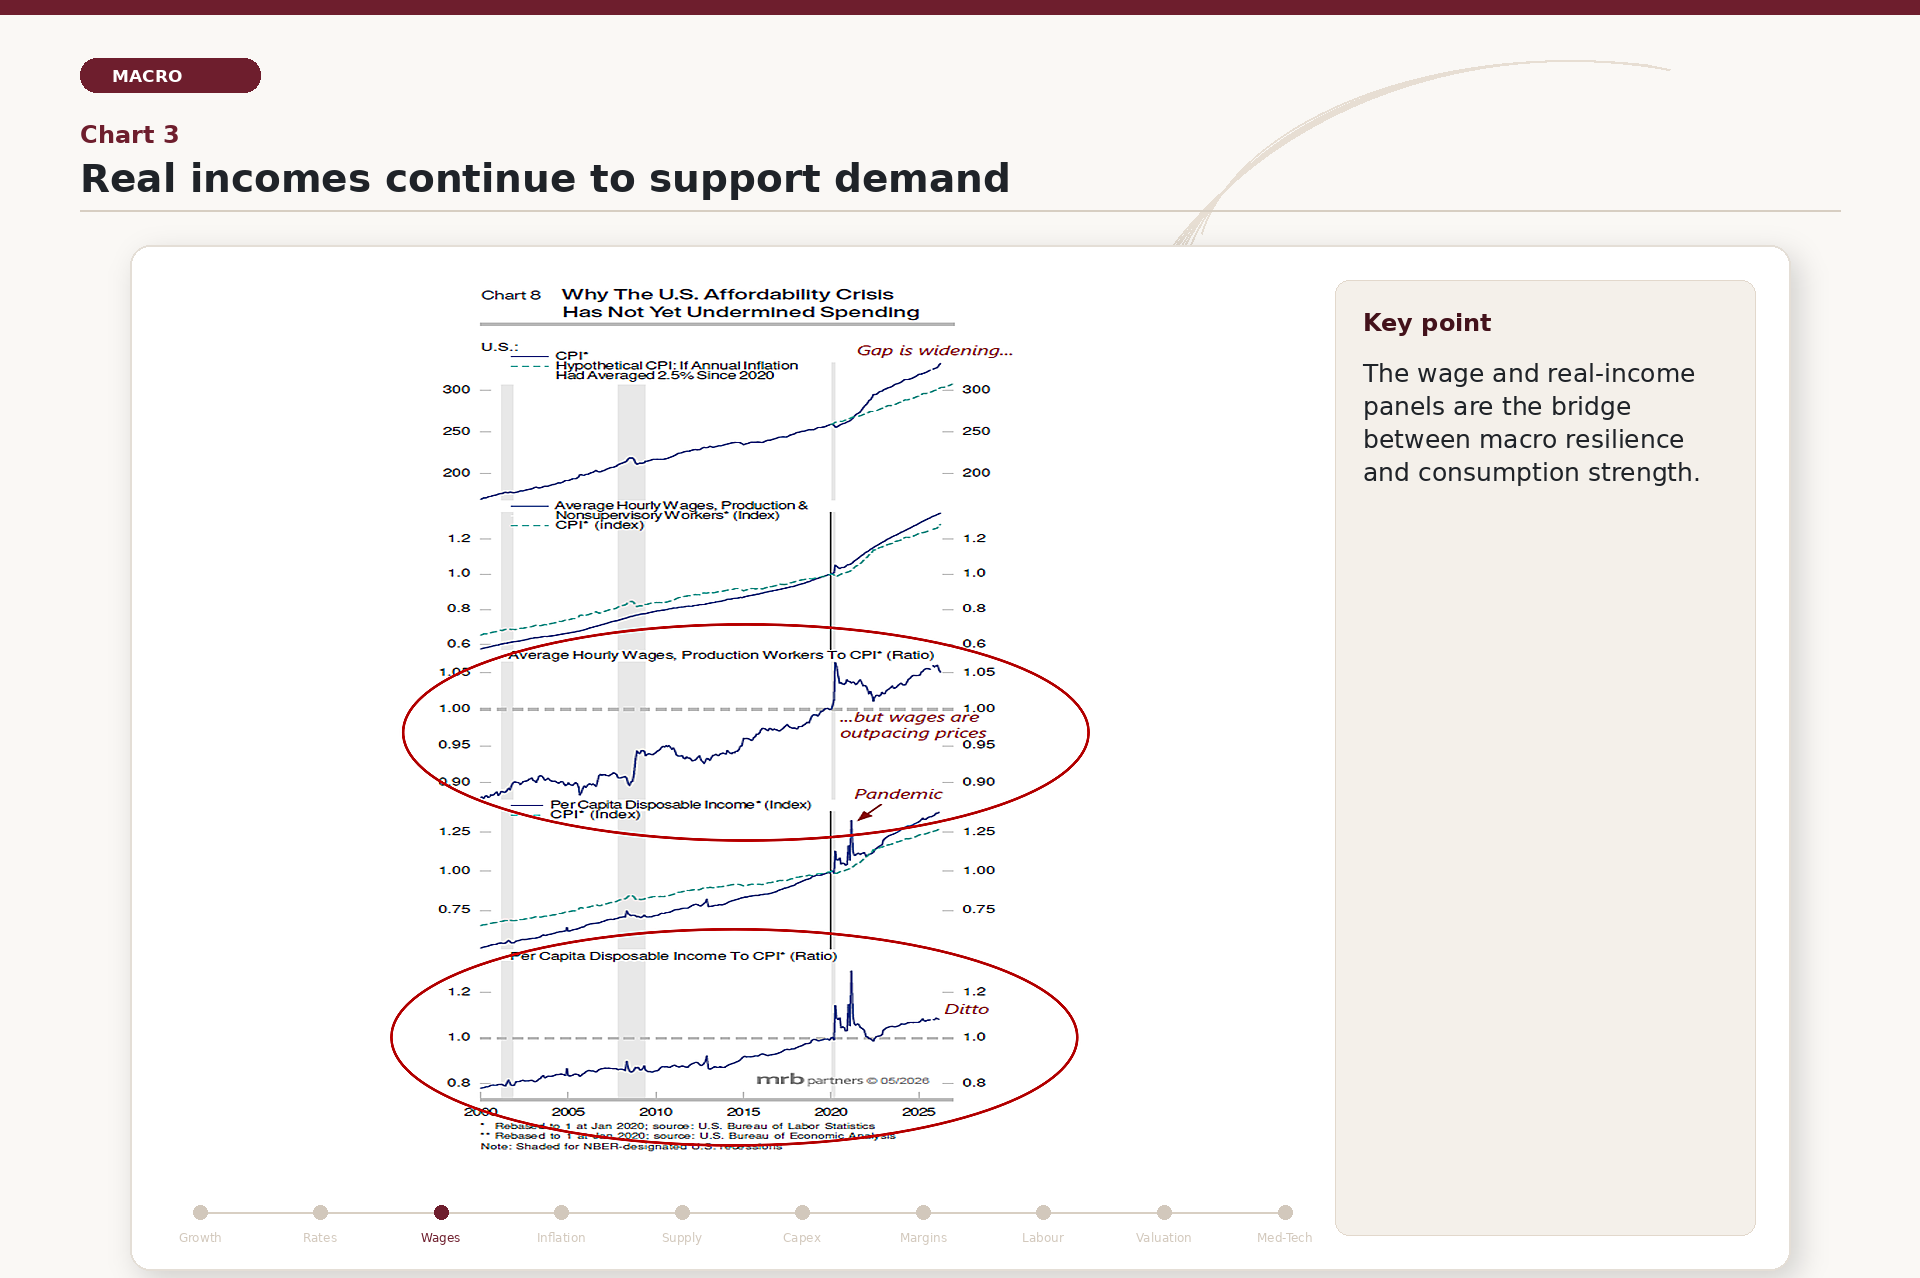
Wage dynamics are providing further support to consumption. As shown in Chart 3 (third and fifth panels), wage growth has more than offset the loss of purchasing power caused by inflation, leading to an increase in real incomes.
INFLATION AND SUPPLY CHAINS
|
The second part of the analysis moves from resilience to the inflation risks that could keep policy and markets under pressure. |
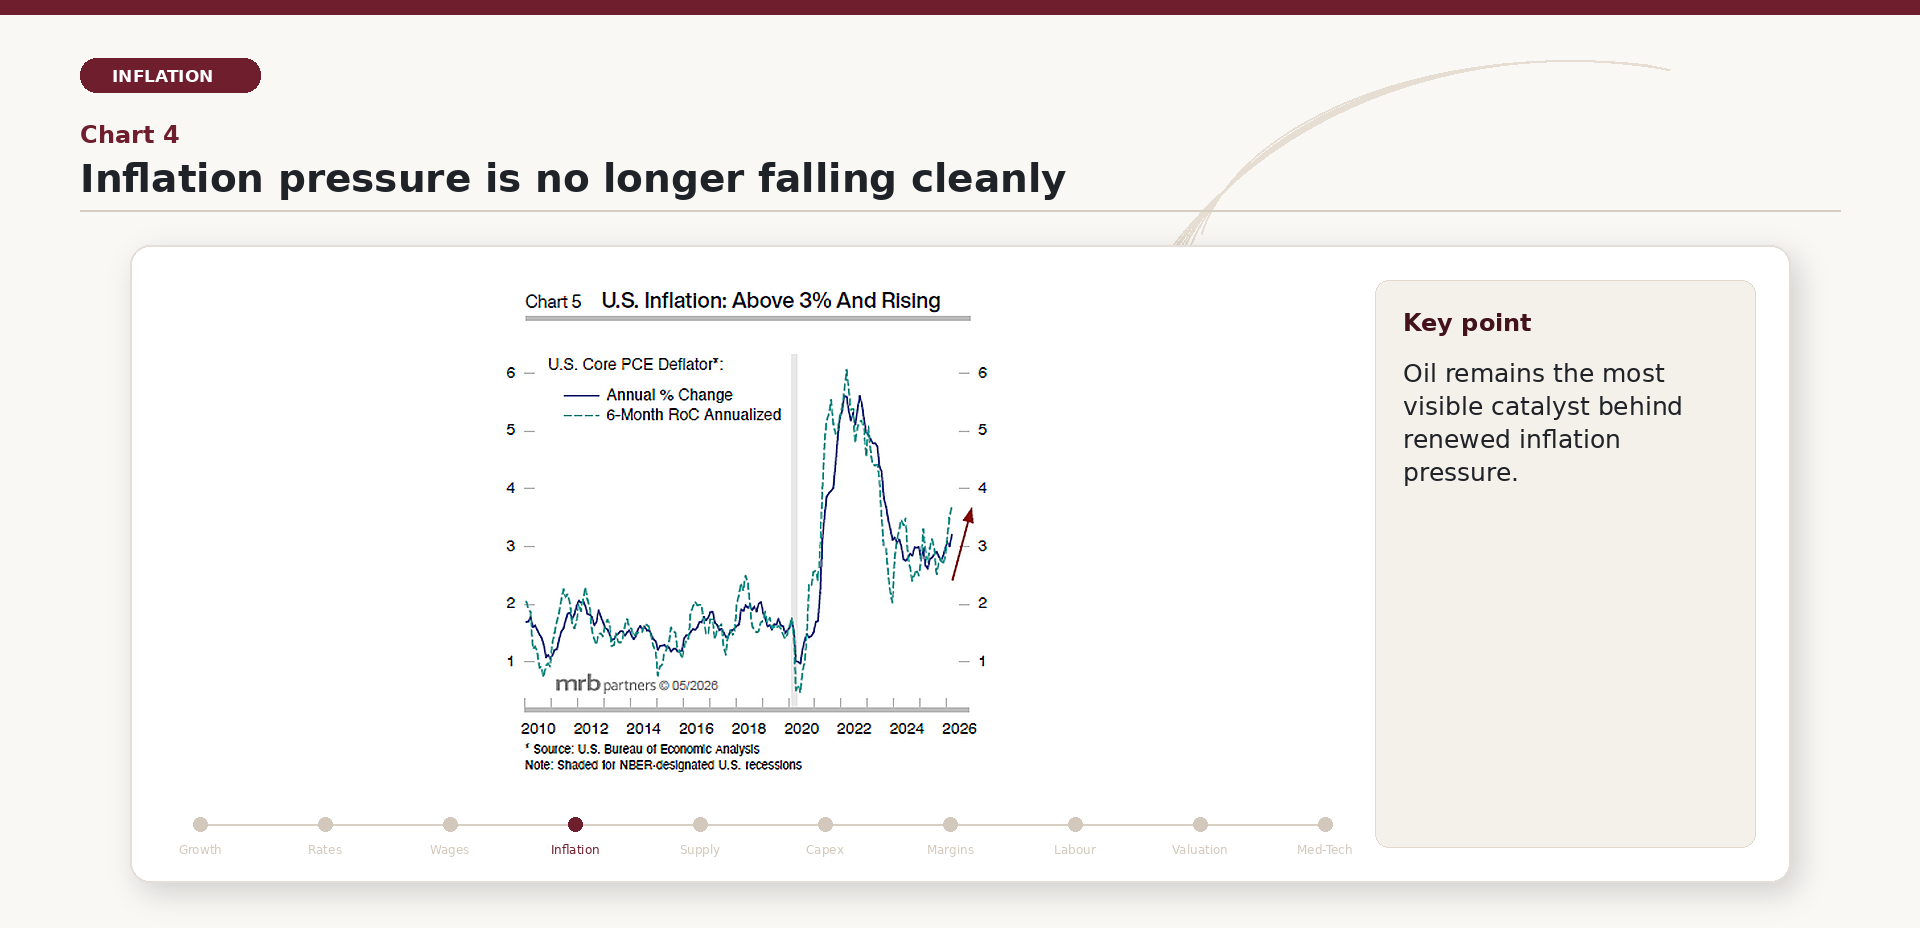
However, signs of renewed inflationary pressure are emerging. Chart 4 shows a rebound in inflation, driven both by a monetary policy that is not fully restrictive and, more importantly, by the rise in oil prices. It is difficult to envisage a sustained return below $70 per barrel, even in the event of geopolitical easing.
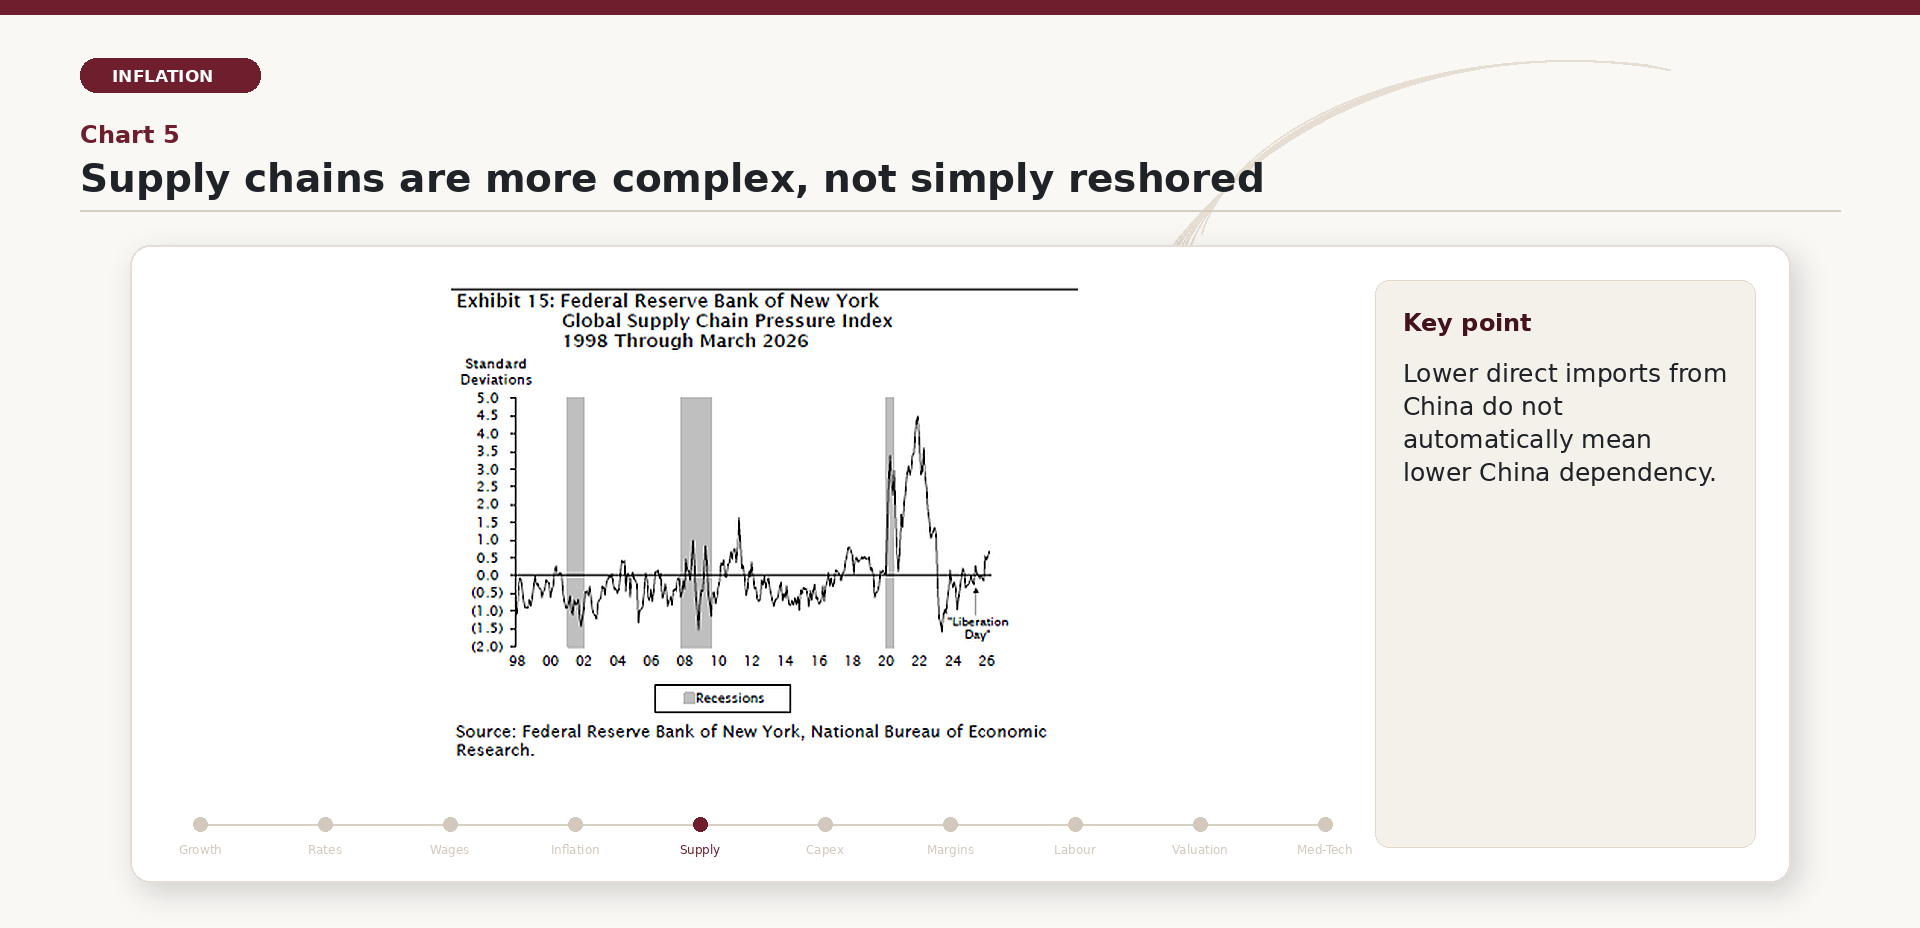
An additional source of inflationary pressure stems from the reconfiguration of global value chains following the trade war between the United States and China. As illustrated in Chart 5, the share of U.S. imports from China has declined significantly (from over 20% in 2018 to around 8%). However, this share has been replaced by imports from other countries that remain heavily reliant on China as a supplier, thereby adding complexity and increasing costs along the supply chain.
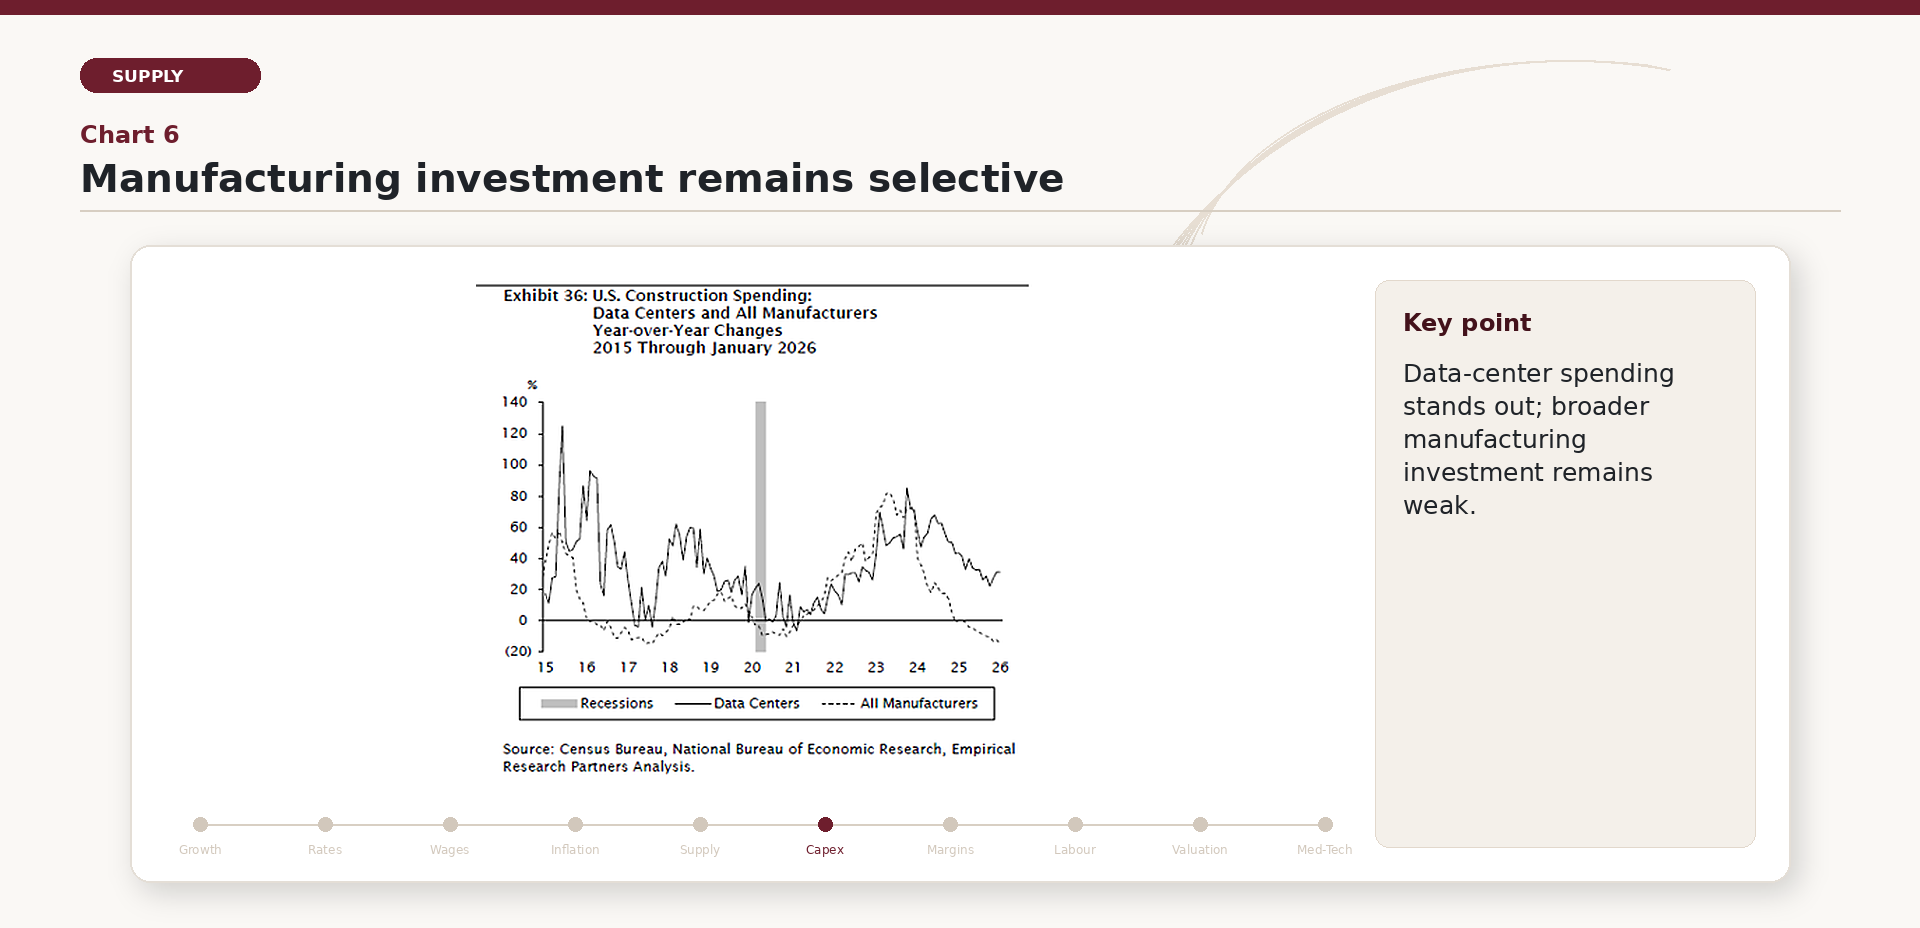
Contrary to initial expectations, the trade war with China has not meaningfully stimulated reshoring in the United States. As shown in Chart 6, overall manufacturing investment remains weak, with the notable exception of sectors linked to data centers and emerging technologies.
MARGINS AND LABOUR MARKET
|
The analysis then turns to corporate fundamentals and to the early employment effects linked to AI adoption. |
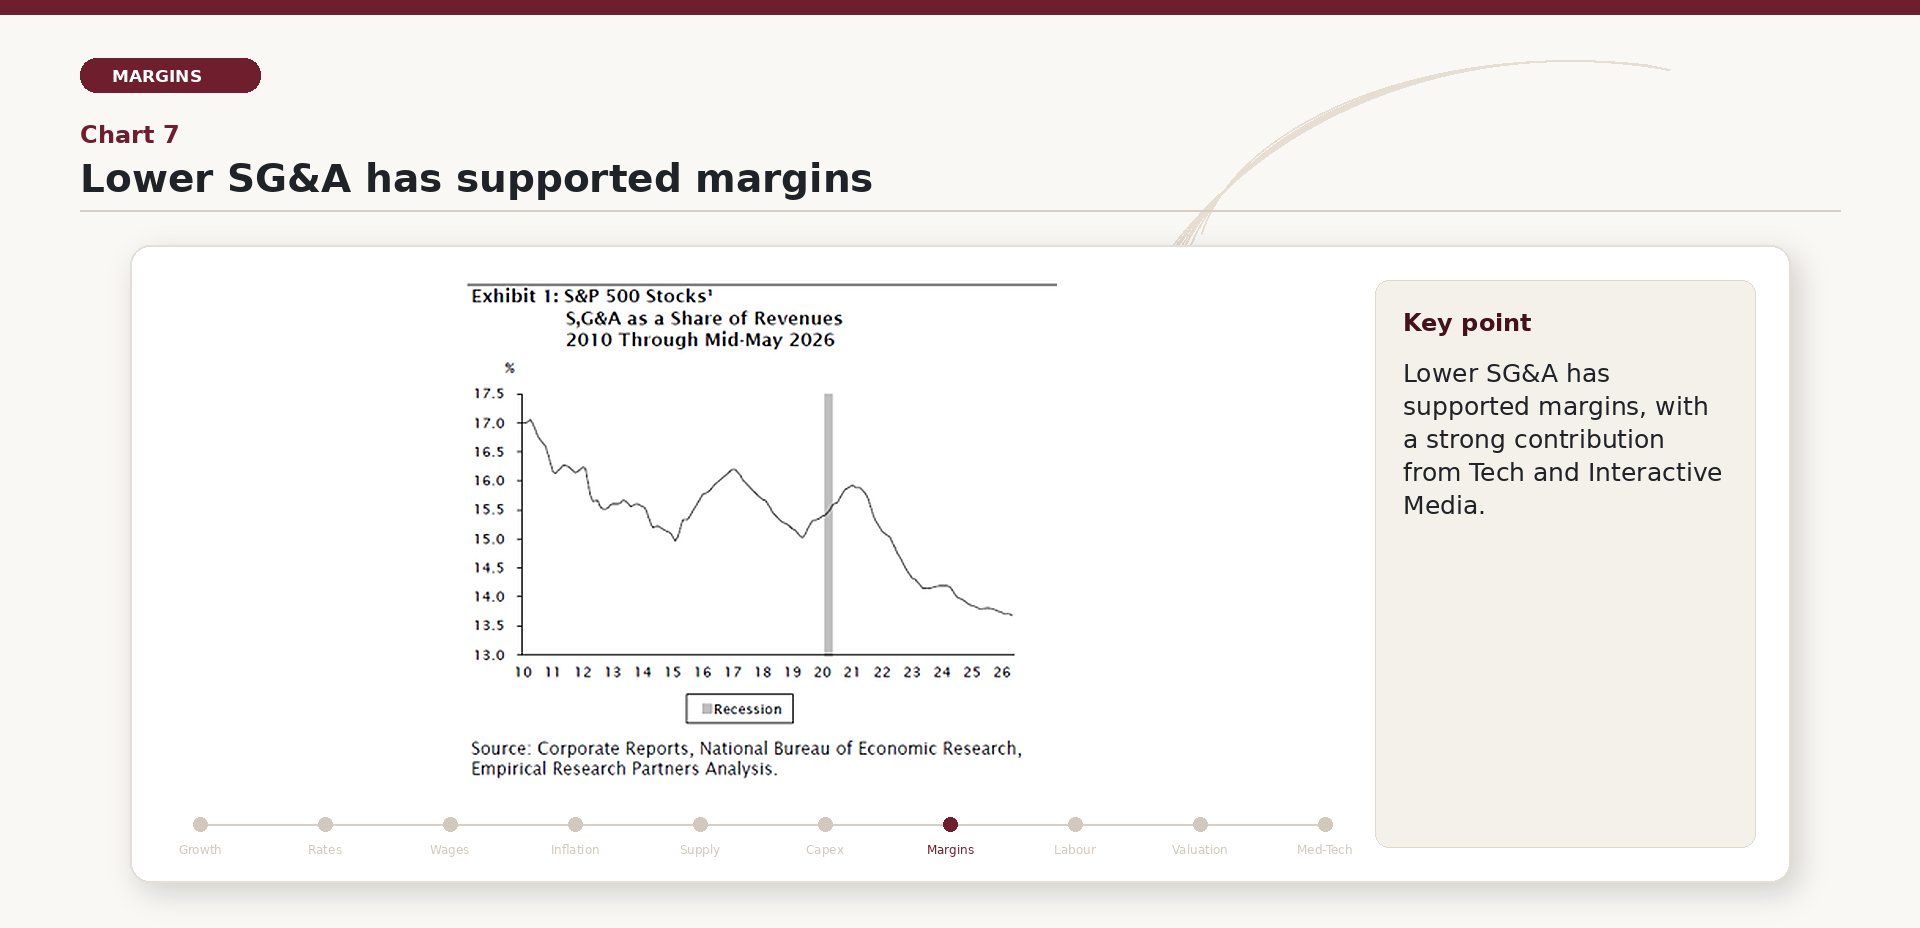
Two additional themes have characterized this period, relating to corporate margins and the labor market: on the margins side, a key contribution has come from the reduction in SG&A (Selling, General & Administrative) expenses as a percentage of revenues, as shown in Chart 7. This dynamic has been driven in particular by the Technology and Interactive Media sectors, which have had a significant impact on the overall performance of the S&P 500.
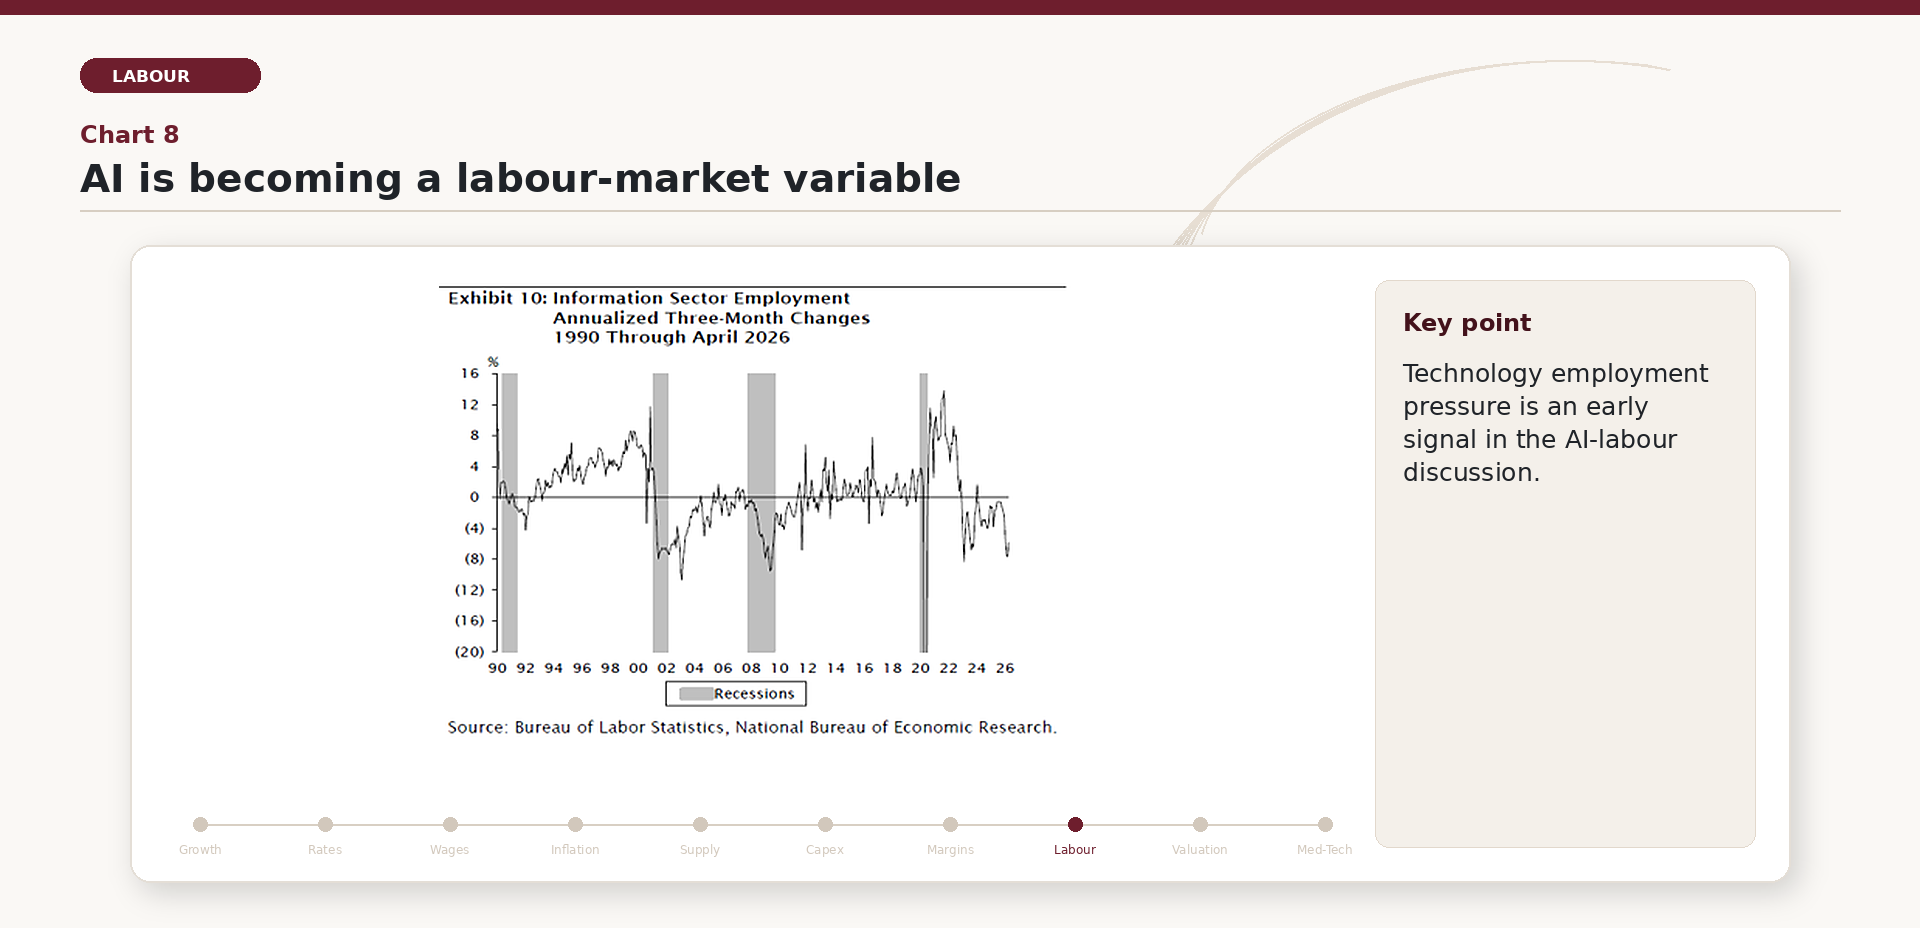
An increasingly central theme is the impact of artificial intelligence on the labor market. Chart 8 highlights a decline in employment within the technology sector, suggesting that the adoption of AI is already beginning to replace certain tasks, particularly in entry-level roles.
VALUATION
|
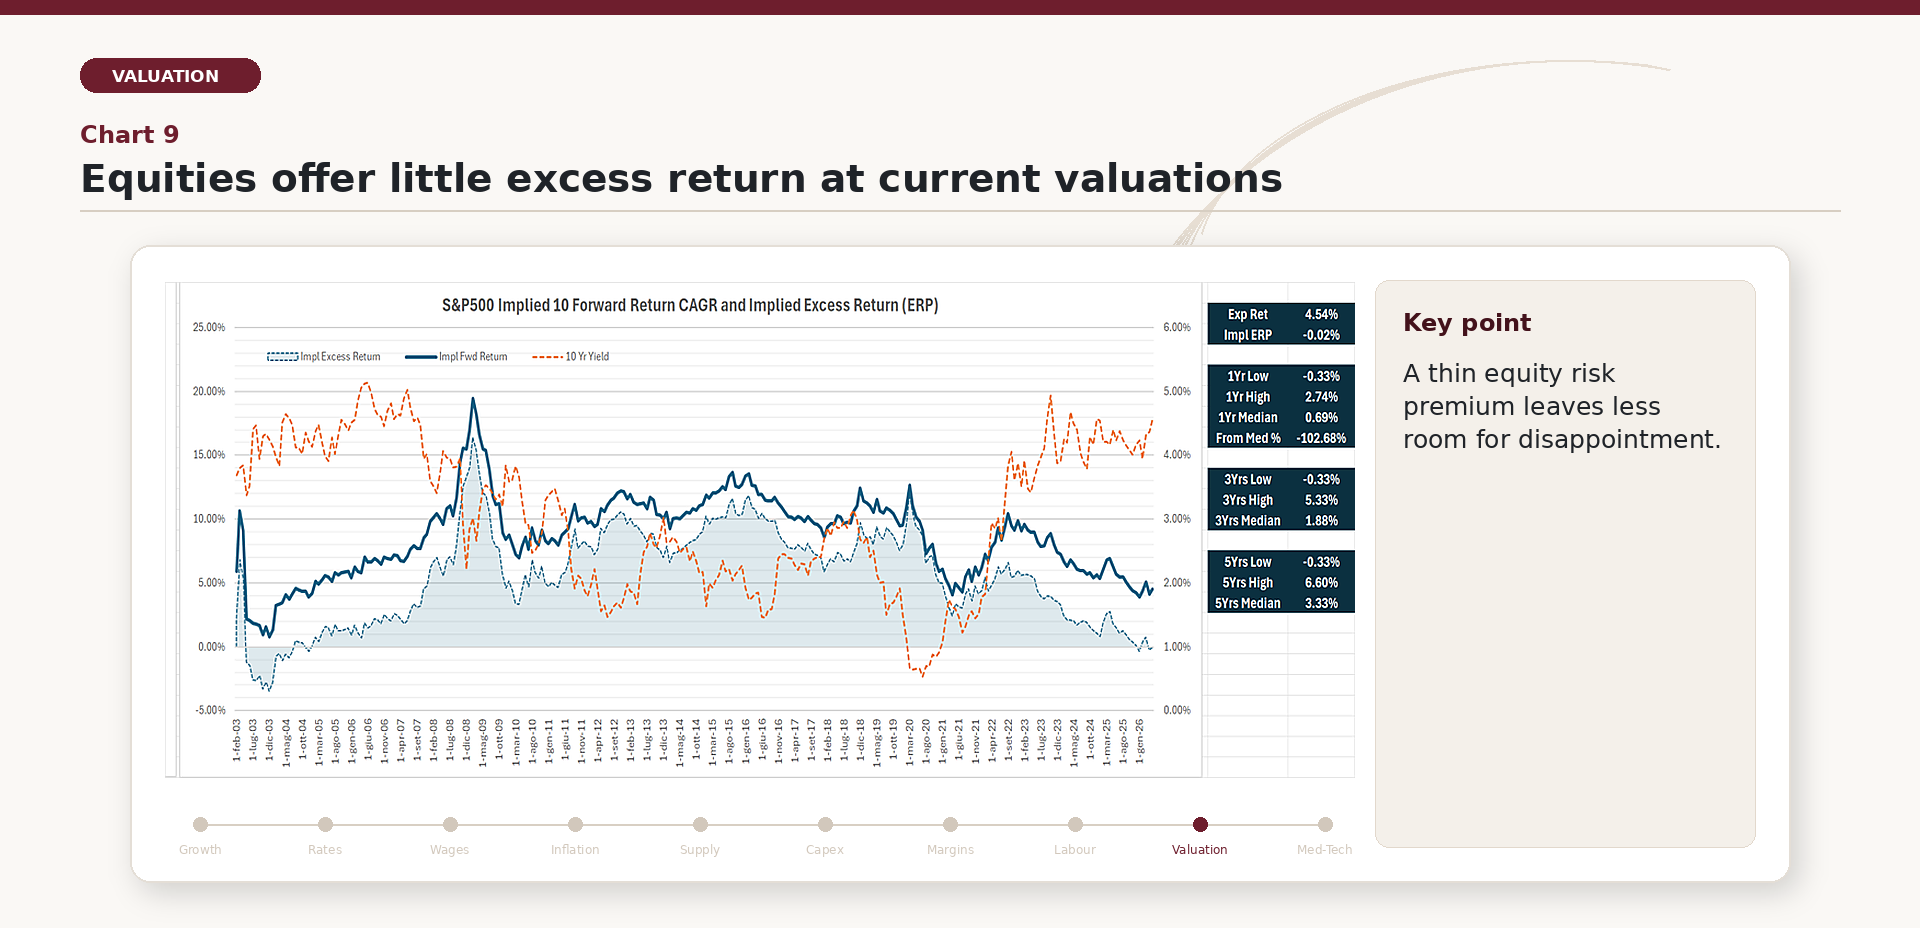
The valuation section translates the macro and earnings discussion into market compensation and scenario risk. |
Lastly, in terms of valuations, Chart 9 shows that the implied equity risk premium of the S&P 500, assuming 11% earnings growth, is currently around zero. This suggests that the equity market is priced at, or better above, fair value, making 10-year government bonds relatively more attractive from a risk-reward perspective.
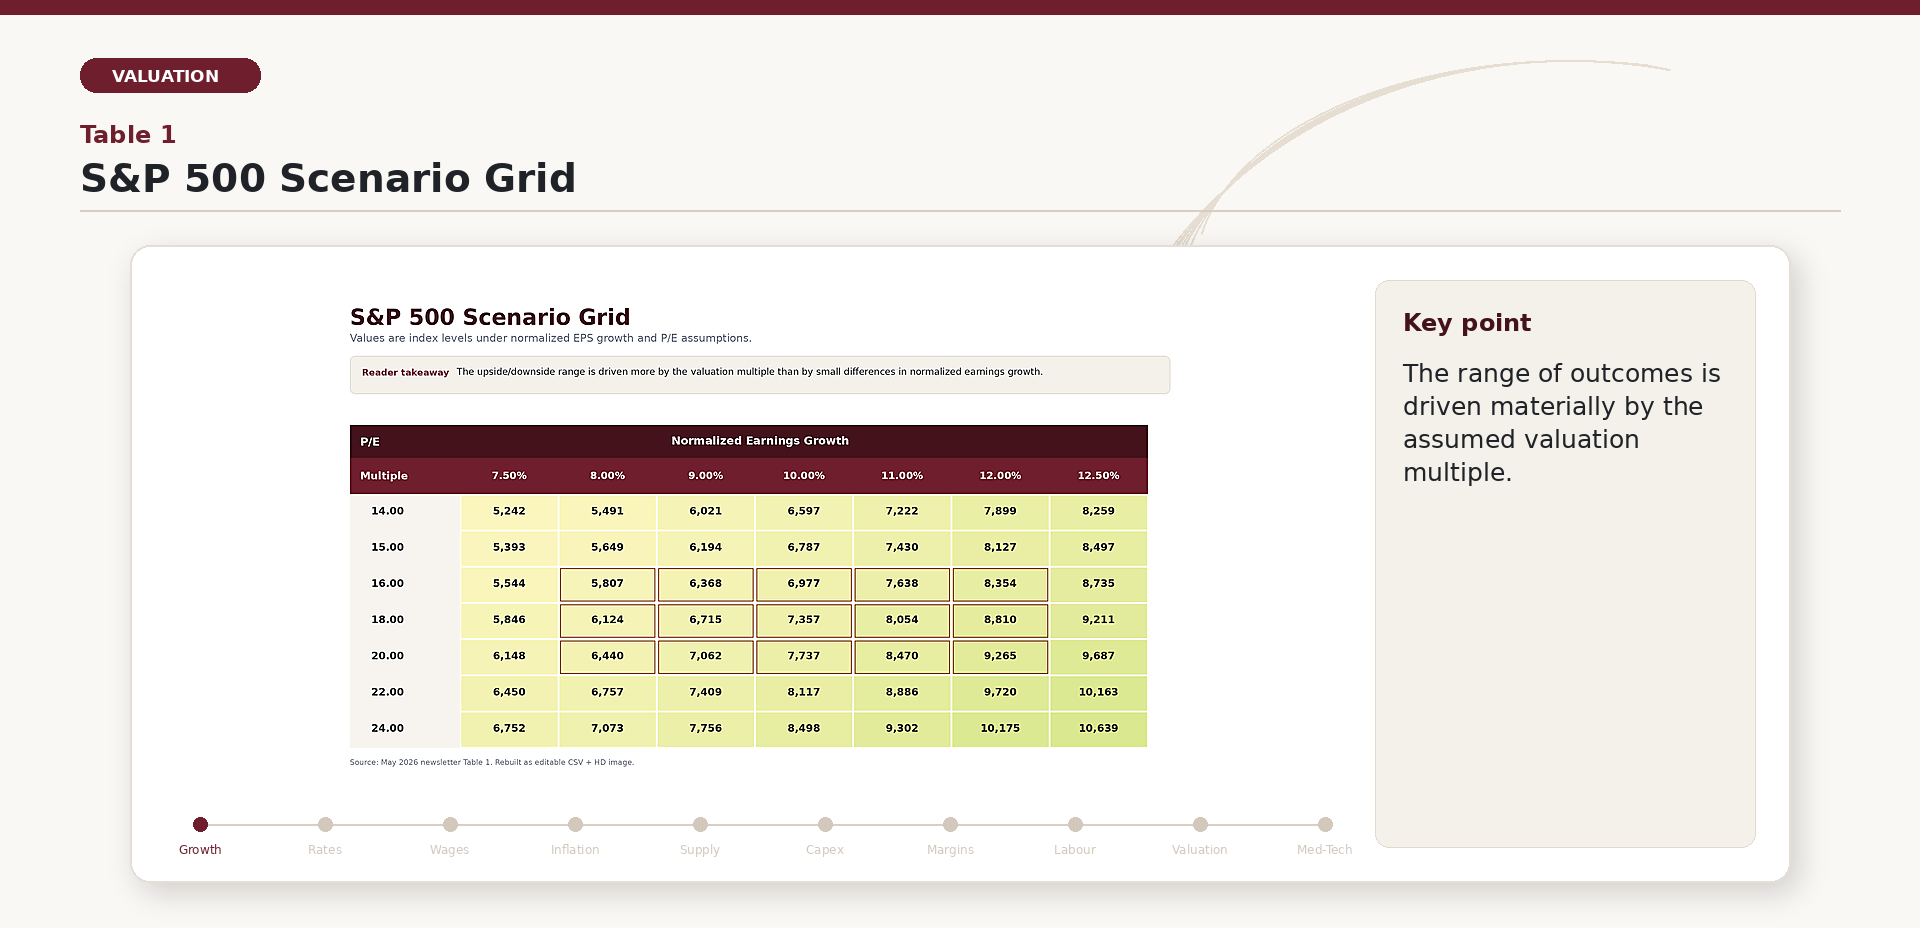
Furthermore, Table 1 presents a sensitivity analysis of potential S&P 500 levels under different assumptions for earnings growth and P/E multiples. The scenarios range from approximately 6,500 points (assuming 9% earnings growth and a P/E of 16) to above 8,000 points under more optimistic conditions. Historically, EPS have grown at an 8.0% rate, but the current Tech and Media skew of the US Index is resulting in a higher growth rate. Until AI will remain center stage, this growth dynamic is unlikely to change significantly. As goes Tech so goes the market.
MED-TECH AS AN AI HEDGE
|
The final section introduces med-tech as a way to balance AI and momentum exposure without abandoning fundamental quality. |
In a market environment heavily tilted toward growth stocks and momentum strategies, particularly within the AI-driven technology sector, the med-tech space represents a compelling investment opportunity from both a value and diversification perspective.
This segment not only offers attractive valuations but, more importantly, exhibits low correlation with AI and broader tech stocks. As such, it serves as an effective hedge within portfolios with significant exposure to technology themes.
Chart 10 highlights the relative free cash flow yield of the med-tech sector compared to the technology sector. This metric is particularly relevant as it reflects companies’ ability to generate cash relative to their market valuation. Med-tech demonstrates stable and consistent growth, with margins that, while lower than those of the tech sector, remain robust and, importantly, more predictable over time.
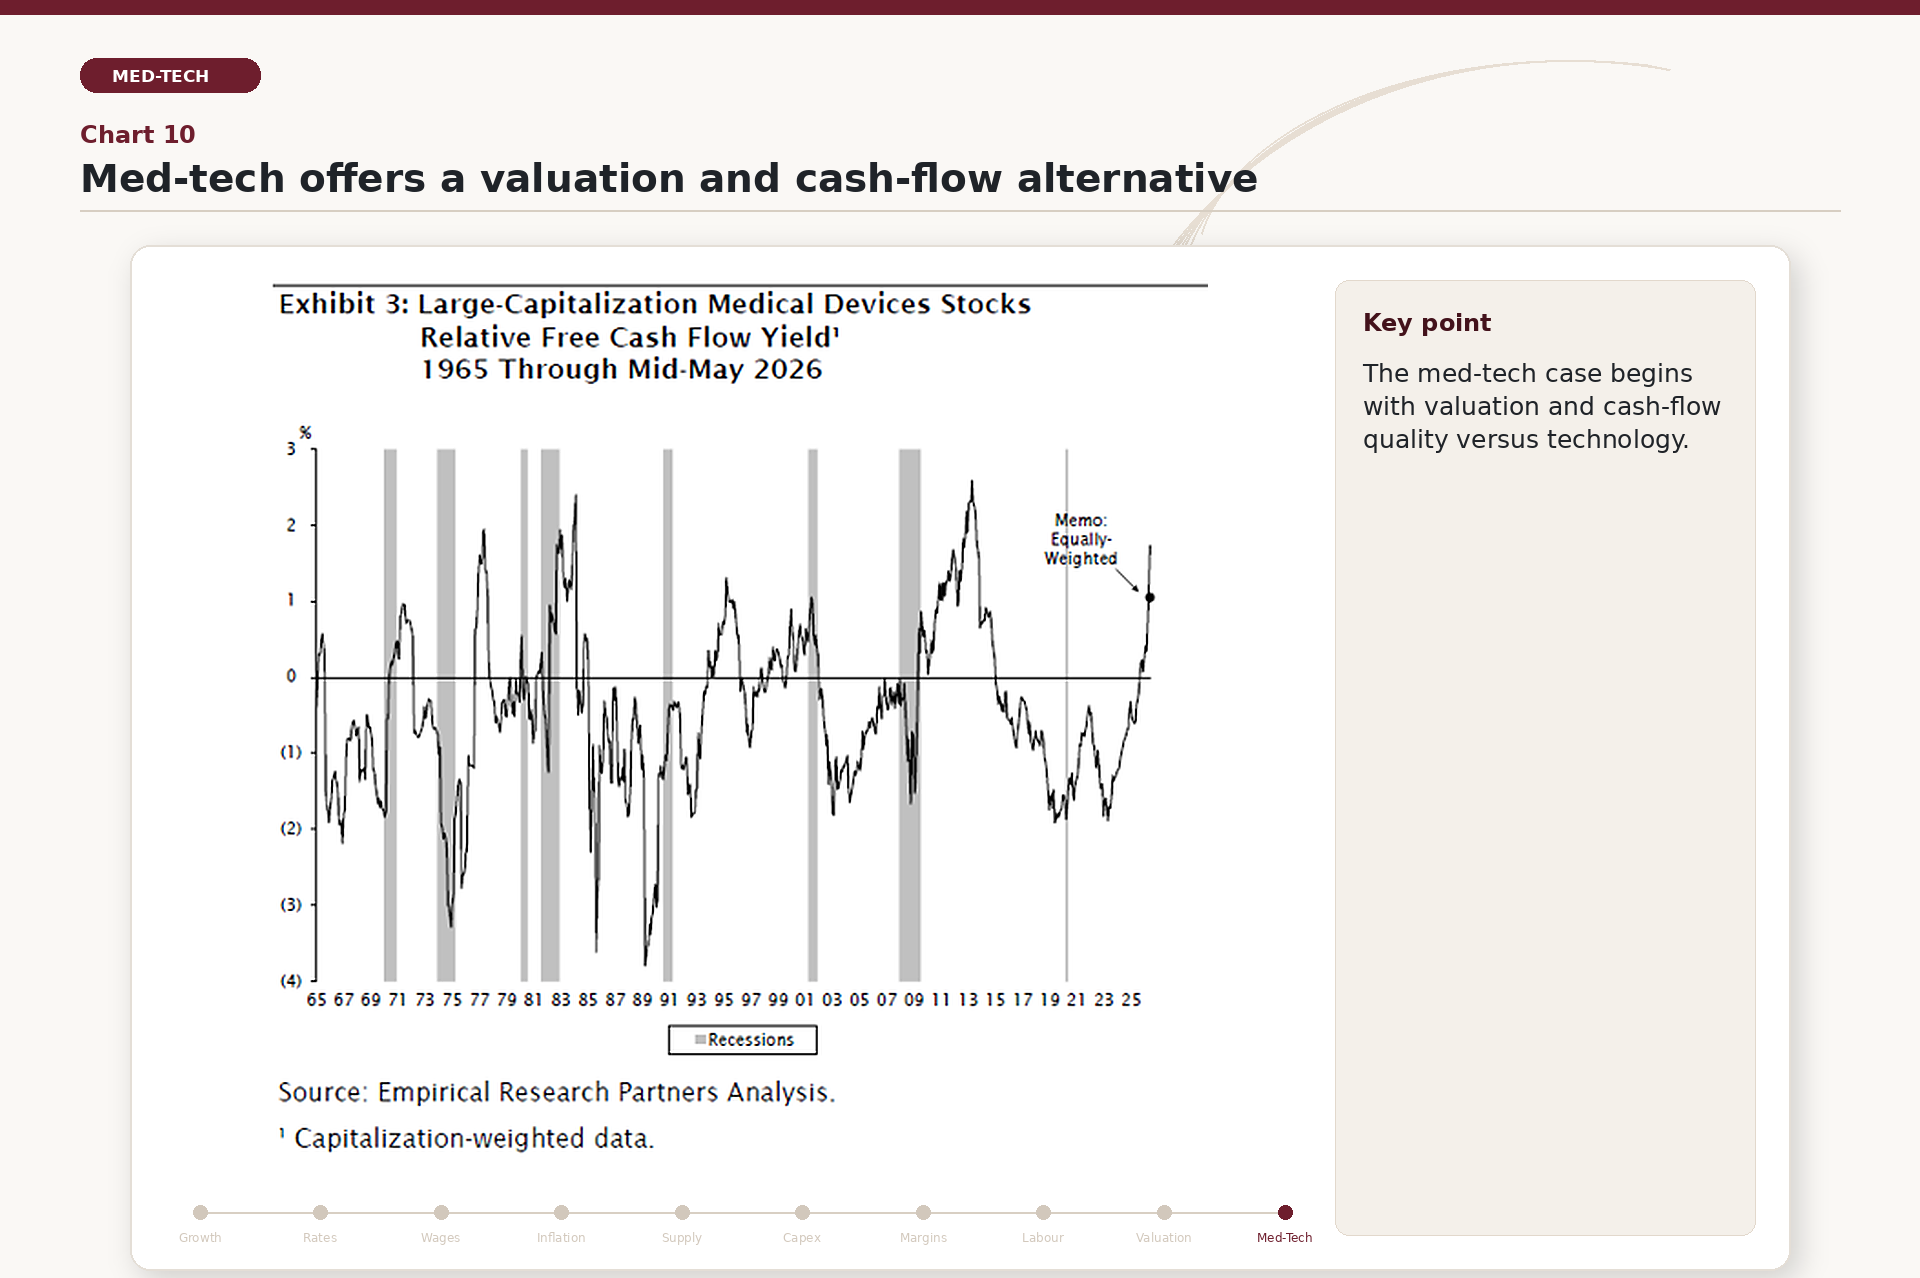
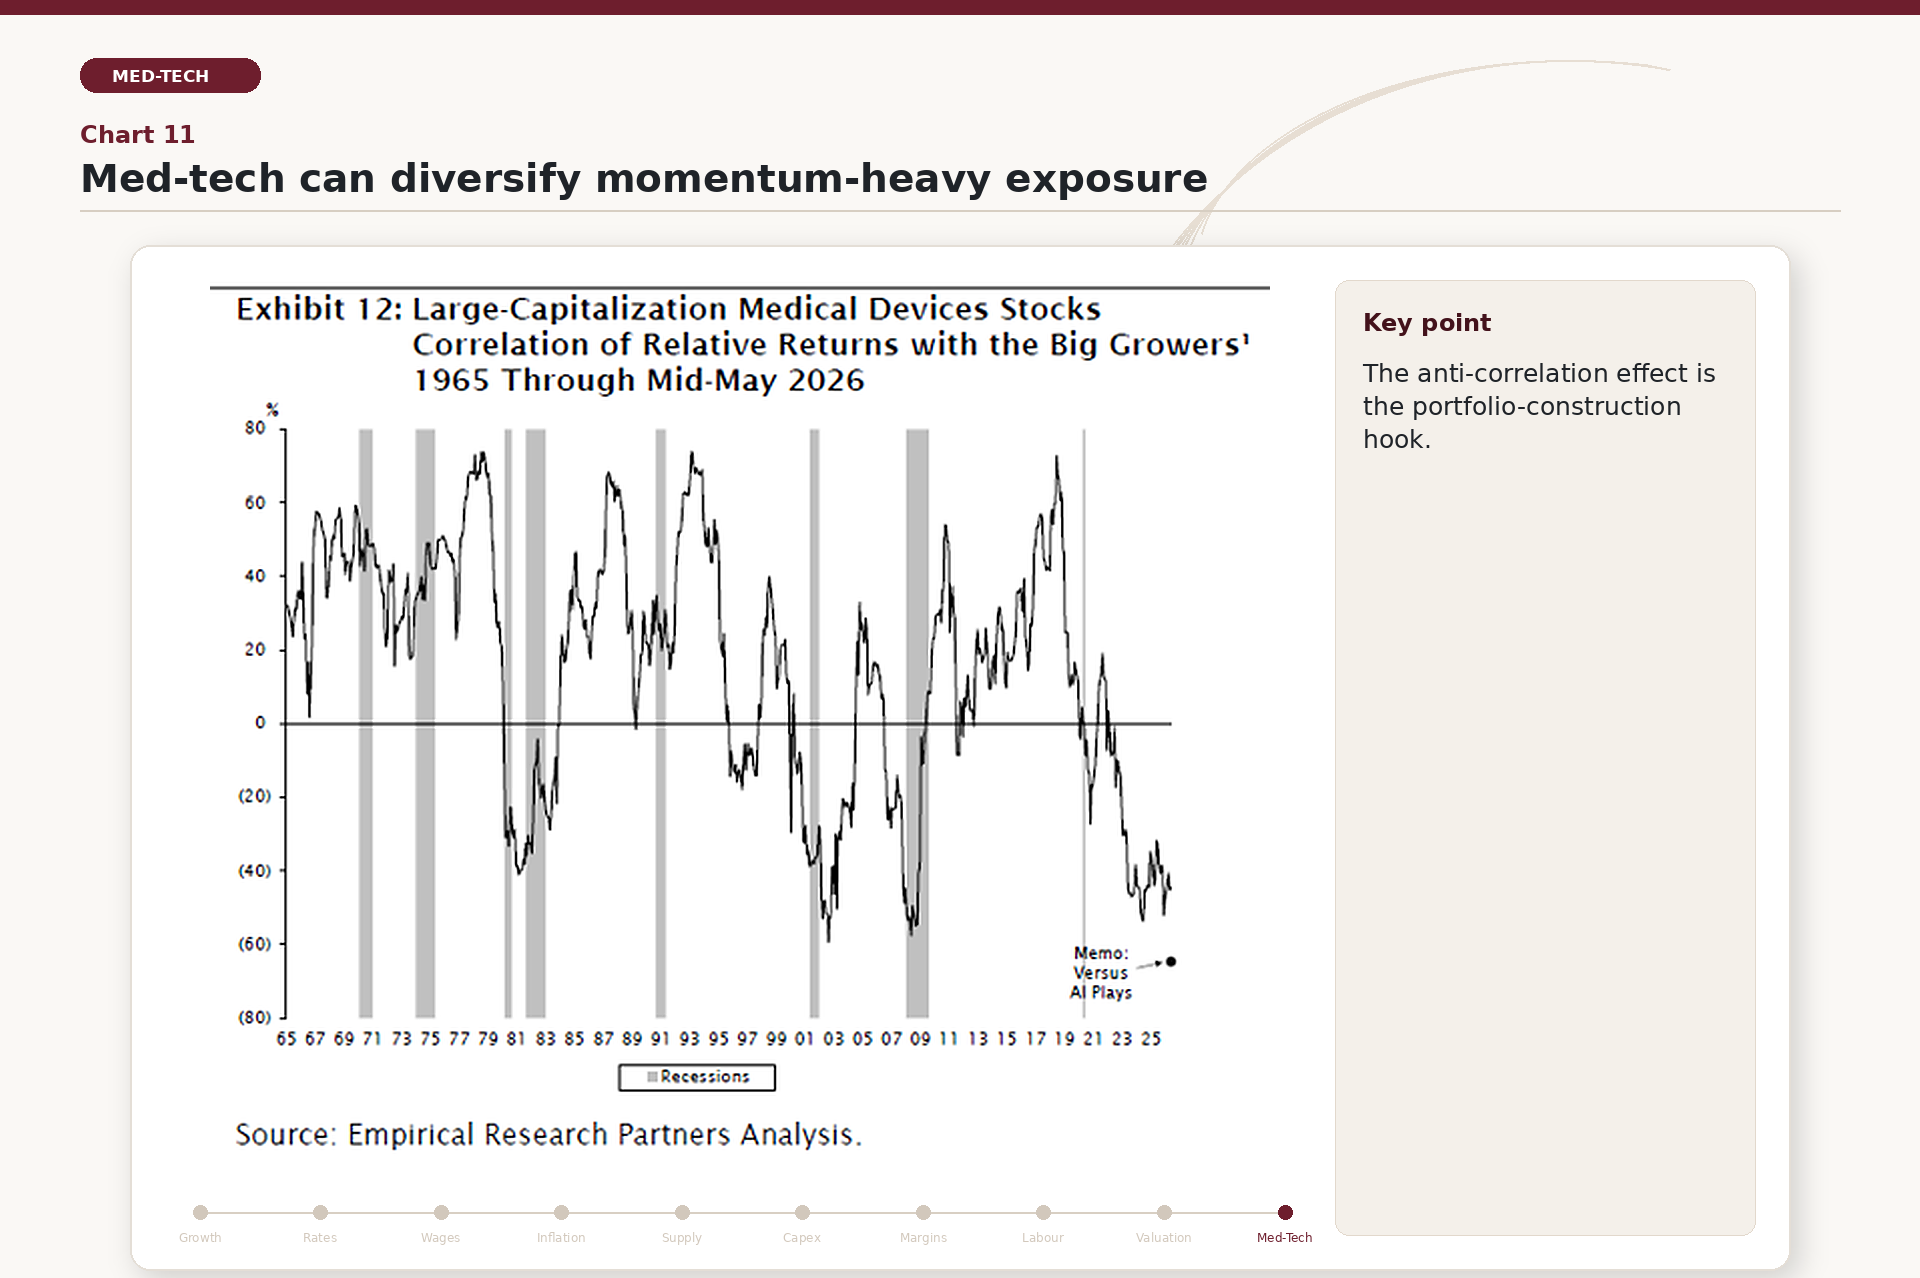
Chart 11 highlights another key aspect: the negative correlation between the med-tech sector and high-momentum stocks. This anti-correlation effect is particularly valuable from a portfolio construction perspective, as it helps mitigate the volatility associated with concentrated exposure to high-growth themes.
In light of these considerations, the med-tech sector emerges as an attractive strategic opportunity: on one hand, it offers compelling valuations and solid fundamentals; on the other, it enhances the overall risk-return profile of a portfolio thanks to its negative correlation with the main current market drivers.
About the author
LFG+ZEST SA